For nearly 20 years we’ve been working on surveys focused mostly on compulsory school assessment. Back in 02009, we wrote Skólapúlsinn: Educational Assessment which outlined the project at the time. A lot is the same, but we continue to evolve with new technology and needs. In 02021, we wrote about how we introduced Robocalling into our tool set.
This fall we started to A/B test when we are sending the reminders to better get a response rate on each point of contact.
Reminders Flow
In general, each survey takes approximately one month from start to finish. Since we are working with institutions, they supply us with a list of participants, these could be students, staff or parents. Depending on the survey we might take an anonymized stratified random sample. This is our list of participants that need to be contacted. We do NOT turn over any day with less than 60% response rate and we push for an 80% response rate for the data to be reliable. That’s a VERY high bar so we need to work as hard as we can to get everyone to answer.
We have 5 ways that we can contact our participants: Email, SMS, Robocalls, Call-outs and in-person contact. We stagger these different ways of communication depending on our survey and time. We are mindful of participants’ time, so we either contacted them during work hours if it was a staff/work related survey, or outside of school hours for parents and students. We did our best to keep it to business days and avoid holidays and family time.
We always start with an email to every participant. We use bulk mailing services and our domains are all set up with DMARC, SFP and more to minimize spam. Email is cheap and easy. We try to keep the message short and encouraging for participants to take part. We send the emails ourselves so we have the ability to add in custom mail merge variables to put the age, name, organization and more in the message. This helps more directly communicate the message.
As a result, we get a good 10-15% response rate. These are folks who get the email and act on it immediately.
We also know that email goes into spam. Our second point of contact is an SMS. At this point every participant should be aware of us. With each reminder, we only contact people who have not yet finished the survey. Once you complete it, you don’t hear from us again. SMSes are more expensive than email, but much cheaper than a human phone call!
The response rate usually jumps another 8-10%. The SMS both acts as a reminder for people who saw the email, but forgot or didn’t immediately have time to do it. It is also catching all the people who never saw or opened that first email. Our surveys are mobile friendly, so clicking a link from an email or SMS to taking the survey is very low friction.
Our third reminder is another email. We stagger our reminders with a few days in between each. Each month and year the calendar is different and we have to work around weekends, holidays and more. The cadence is usually pretty similar. We want to have sent the majority of our reminders by the middle of the month. That gives our contacts the last 2 weeks to get the response rate to an acceptable level. Usually this third reminder is sent 5-6 business days after we started.
Fourth Reminder (maybe) is an email. Depending on the sending schedule the fourth reminder is another email reminding, or warning, participants that in a day or two, they will receive a robocall from us. This is an automated call asking them to take the survey and allowing them to get their code emailed to them again. This is available in Icelandic, English and Polish. This email is a heads-up and an opportunity for participants to opt-out. The robocall warning is either its own email (reminder #4) or folded into our second email (reminder #3).
Fifth Reminder is our robocall. We usually employ the robocalls to great effect. We’ve written about Robocalling before, but it allows us to go wide, fast and put a longer explanation than we could in an SMS. These are also less likely to go into spam, but we do get a lot of early hang-ups too.
At this point, it’s about the middle of the month and we’re switching gears to push the responsibility of what’s left to our contacts in the organizations. They can see the list of people remaining who have not started the surveys. They can take direct contact when the parents collect students and/or send a personal email or message. At this point, what was the big list is now pretty small and much more manageable to get a reliable response rate. Sometimes the duty falls on us and we’re paid to make individual human phone calls. These are the most expensive, but also have a personal touch and can answer any questions when we talk with people.
At this point, we’re wrapping up our direct contact with participants. We usually send two more email reminders, one with a week left and one with 24-48h left.
This format has gotten us the response rates that we needed for years, but maybe we could do better. Times are changing, our participants are of different generations, it was time to try something new.
A/B Tests
The surveys themselves are very academic and we should not be experimenting with the contents, but we can try and see if the way we send our reminders has an effect on the response rate.
In October, we ran a survey for high-school students. We collected their name, email, phone, school and credits. We sent our first 3 reminders (email, SMS and email) like normal. The plan was to Robocall students the Monday after school.
We noticed that the response rates were lower than “normal”. These are high-school students; taking a survey is not their top priority, so we weren’t expecting amazing numbers, but something was off. Our theory is that in this generation email is not the best form of communication. Some of the emails might have been school emails rather than personal, so the frequency they check it might be lower or spam scores higher. We see pushes to using school apps or web portals for important communications, not email. The SMS we sent garnered a similar if not better response to our other surveys. That set us off on some A/B tests that we’ve learnt from and will adjust for the future.
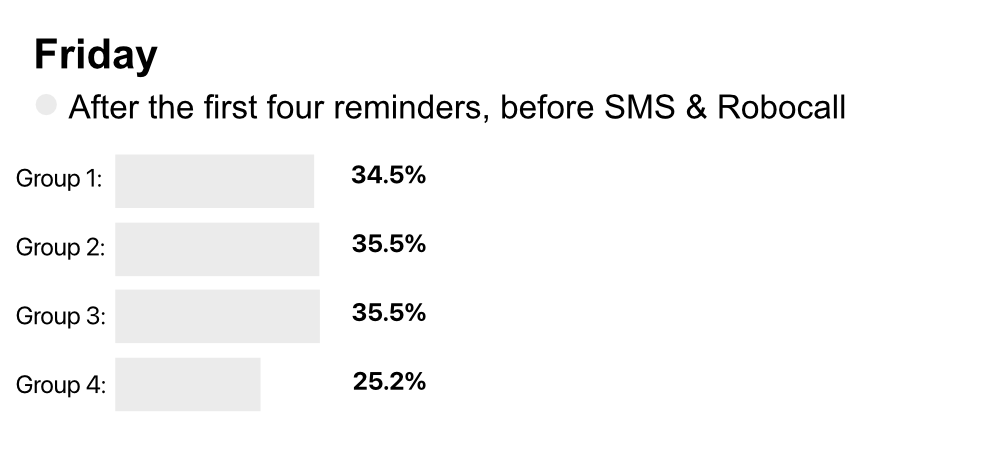
We split the list of organizations into 4 groups. Three test groups and one control group. We choose the schools with the highest and lowest response rates as Group 1. Group 2 was the second highest and second lowest. Group 3 was the 3rd highest and lowest. At this point all four groups had roughly the same average response rate.
Since emails seem to not be getting the response we’d hoped we moved to testing with SMSes.
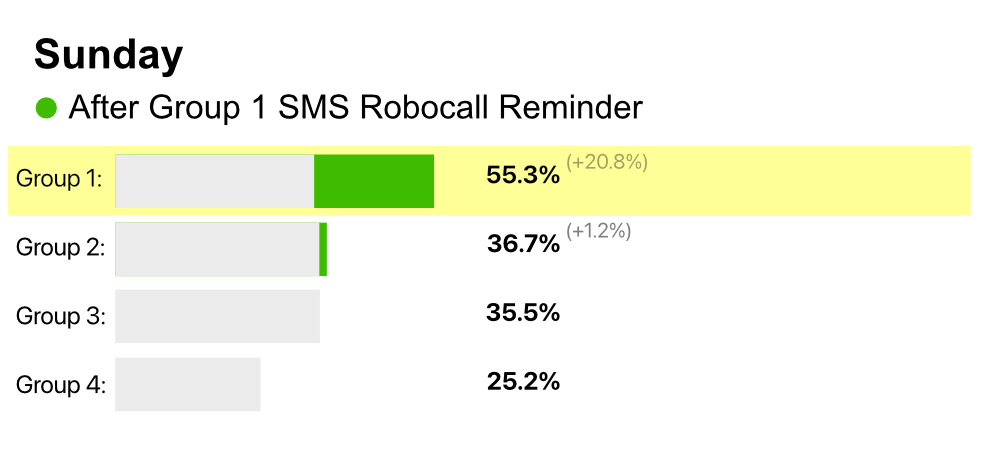
On Sunday, the day before the robocall, we picked Group 1 and sent them an SMS. Our assumption was that high-school students missed our reminder emails because they don’t check email. This SMS was the robocall announcement replacement. Sunday was a bit of a gamble: they have time, but it is a weekend. Comparing their pre-SMS and response rate with that on Monday morning before the robocall, we got a 20% bump! We also see a small increase in Group 2 who did not get any SMS. This shows that students are continuing to answer based on previous reminders.
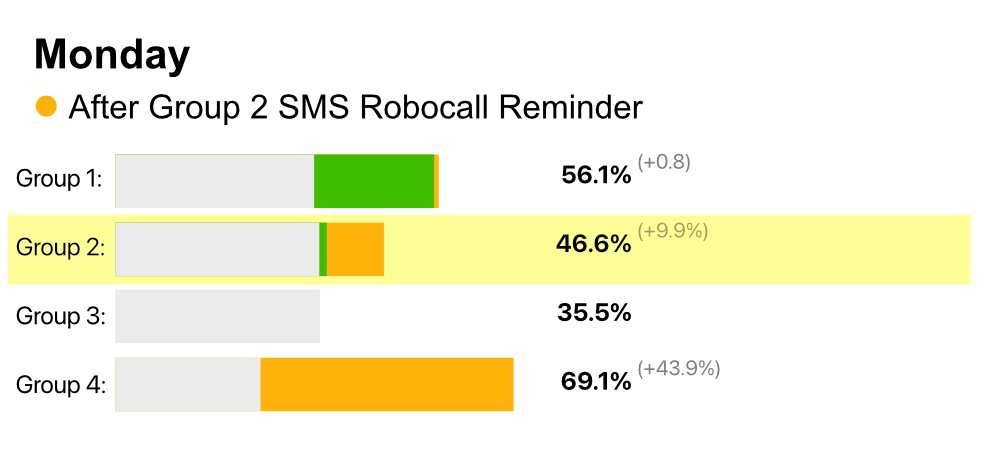
Excited about those results, on Monday morning we sent Group 2 the same SMS saying You’ll be robocalled this afternoon. We wanted to see if warning them in a shorter time frame made them act sooner rather than on Sunday were they might put it off until later and forget. We did get a bump, but a smaller ~10%.
Group 4 is an anomaly. We suspect the school staff have intervened to remind students to take it!
On Monday after school, we sent out the Robocall to all four groups and Tuesday morning we went over the new response rates.
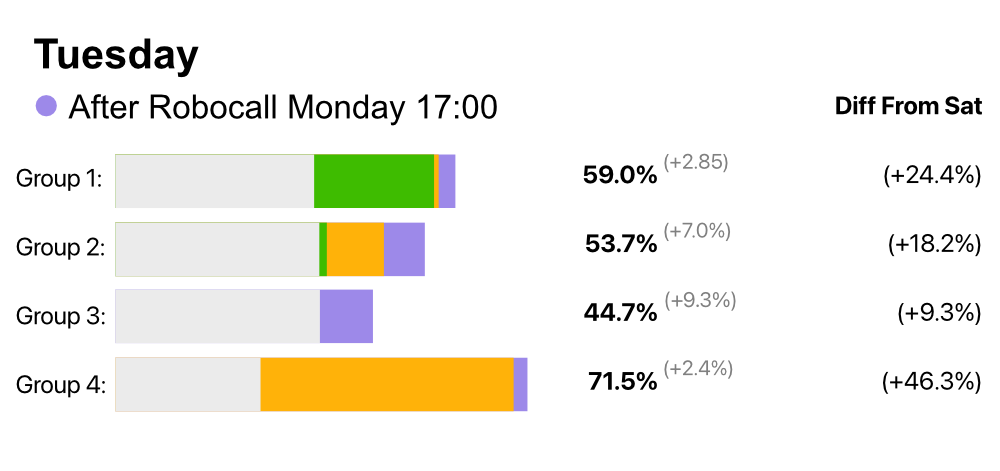
Group 1 didn’t move much. If we interpret it correctly, we are assuming that all the people who were willing to take the survey have done so already. The Sunday SMS reminder pushed all the people who would have taken it because of the Robocall to do it sooner.
Group 2 had a 7% response increase. If we compare the sum of their Monday SMS & Robocall response increase (17%) it is comparable to Group 1’s bigger Sunday SMS response plus smaller Monday Robocall Response (24.5%).
Group 3 who did NOT get any SMS pester increased their response rate by ~9%.
On Wednesday we emailed all the participants about the status and time left to complete the survey. To make things fair, we also sent a general SMS reminder to Group 3. Now Groups 1, 2, and 3 all received SMS reminders and we can see how that has impacted their overall response rates.
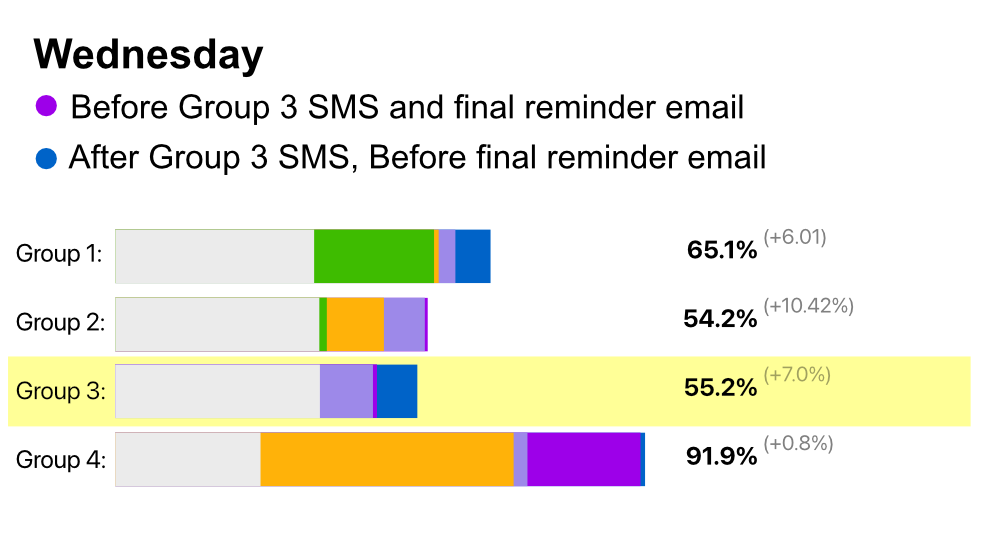
We can see that Group 3 jumped another 7% based on the SMS, but Group 1 also increased. There is a lot of possibilities on why this might be. Group 1 has gotten lots of reminders, but so has Group 2. Maybe someone in the Group 1 organizations has reminded them outside of our knowledge or this could just be an anomaly.
Using all this information we can re-calibrate the effectiveness of spending money on a Robocall rather than another SMS reminder.
Robocall Logs
To better understand the effectiveness of our Robocall we looked at the logs and glean some additional information.
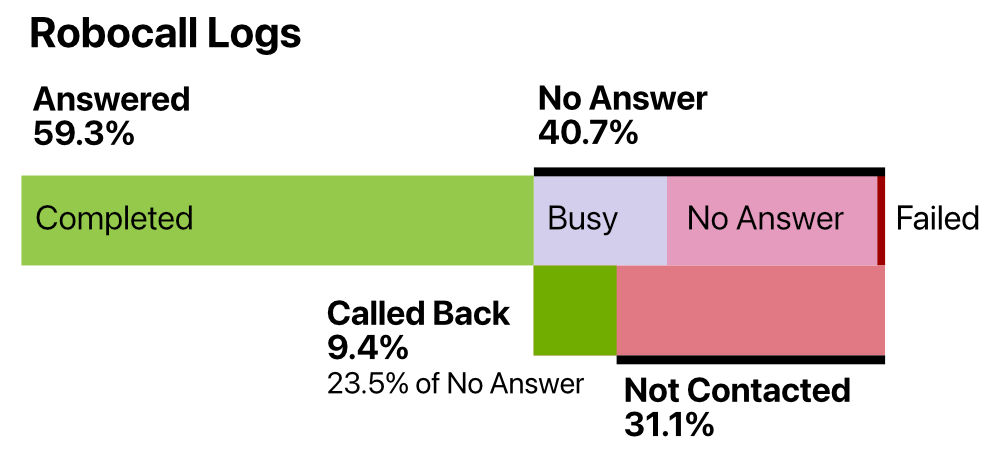
~60% of the participants answered the phone. Which means we didn’t get through to 40%. Either the number failed, it was busy or no one answered. (Busy might be the ‘ignore this call’ button)
We looked at the logs for both outgoing and incoming calls. By the next morning, we can see that incoming calls accounted for a ~10% increase. These call-backs get the automated message reminding them about the surveys. It is surprising to see about 1 in 4 people who missed the robocall and didn’t recognize the number, call it back!
After robocalling, about 65-70% of participants left to answer, they were now aware of the survey and that we wanted them to take it. Which leaves 30% of high-school participants left to start, ignoring or not receiving our robocall reminder.
At this point, the average survey response rate was around 60%. That means we Robocalled 35-40% of the original participant universe. The 30% we could not reach at all with a robocall, was 30% of the remaining 40%, which is somewhere between 10-15% of all survey participants.
Halfway Point
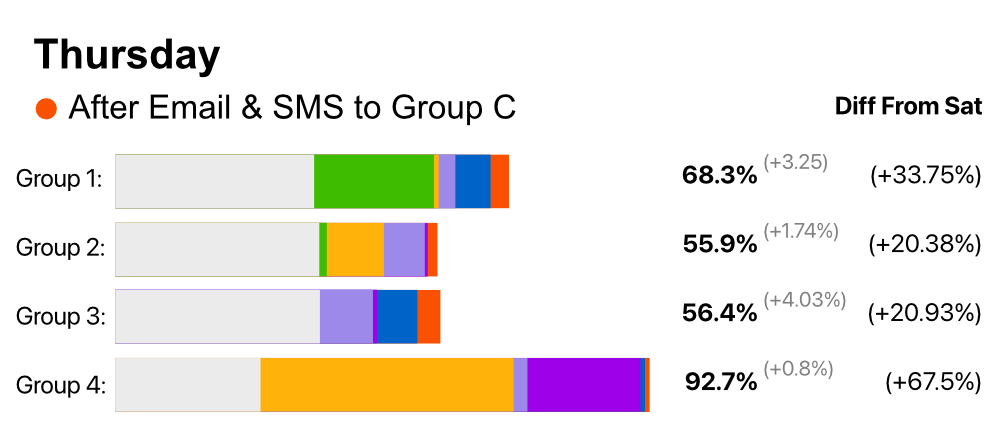
At the half-way point we’re very close to the 60% mark for our groups. This is the absolute minimum needed to get some results. It also means that only 40% of the original list (and realistically only half of that need to answer to get to 80%) is left for our organizational contacts to remind directly.
From the chart, we can both see diminishing returns on each reminder. We also see activity even when groups are not contacted directly. This is probably due to our contacts in the organizations reminding or pulling participants aside to take the survey.
We contacted Group 1 on a Sunday and got a 20% bump, we contacted Group 2 (same message) on Monday morning and got a 10% bump. What was different? More time on the weekend?
At the halfway mark, Group 1 is 13% higher than Group 2. We can see that extra 13% carried through from the Sunday SMS. Why did this group’s fatigue differ? Is a weekend SMS reminder something to think about for future surveys?
Take-a-ways
We knew there were always diminishing returns with reminders. Our first two reminders, Email and SMS, immediately get the people who are ready and willing to contribute. If we’re close to the 20% mark we’re excited. After that, the 80% that are left are harder and harder to contact and convince. Even if we get 20% of the participants who are left to take part, that’s 20% of 80%. While the percentage might stay the same (spoiler, it continues to drop) the universe of participants left keeps getting smaller and therefore the people taking it also gets smaller. 20% of 100 is 20, but 20% of 10 is 2!
We shouldn’t be afraid of sending an SMS on the weekend to students. They have more time and seem to be willing to participate. Our first A/B test show this, but while the number of participants is high enough to be statistically significant, it is still an N of 1 test. Maybe there were loads of external environmental factors that made it an ideal time? Luckily, this is easily repeatable and might become part of our normal reminder schedule if the results hold.
The Robocall didn’t have much of an effect on Group 1 who had a huge increase in participation over the weekend, but it increased the others by ~7%. For now, it is still a useful tool if only for an excuse to send an SMS reminder about it.
We also need to remember that we saw big jumps in participation even when groups were not contacted. There are external influences that we don’t always know about. The organizations might send out a message directly reminding participants or they might be finding them one-by-one and setting them down to make sure they complete the survey. All this helps to increase the needed participation rate, but makes it a bit harder for us to untangle the effects of the reminders. With enough test runs and data it becomes we’ll be able to isolate the effects.
Next time we conduct a survey, we’ll experiment more with when and how we send the reminders. While SMSes do cost money, sending an extra reminder does not impact the overall cost that much. Especially if it allows us to optimize when we send it making the most bang for the buck.
Next Steps
We will repeat the same survey for different customers in April. We’ll try a similar A/B test and see if we can replicate the results. The longer-term goal would be to write this up and submit it to an academic journal as a methods process article for peer review.