Inspiration can strike from anywhere. Knowing how to gather your thoughts and execute is key.
A few weeks ago, I attended an event at the local library in honor of the many Estonian immigrants here in Iceland with my friend Aitor et al. They were demonstrating local customs, foods, dress, songs and other aspects in order to raise awareness of Estonia and gather funds for a potential Estonian House in Reykjavík. Iceland and Estonia have a very strange past. When Estonia broke away from the former Soviet Union, it declared itself an independent nation. Part of the definition of soverenty is that other nations recognize your independence. Iceland was the nation first to step-up and help Estonia rise to the status of independent country by diplomatically recognition.
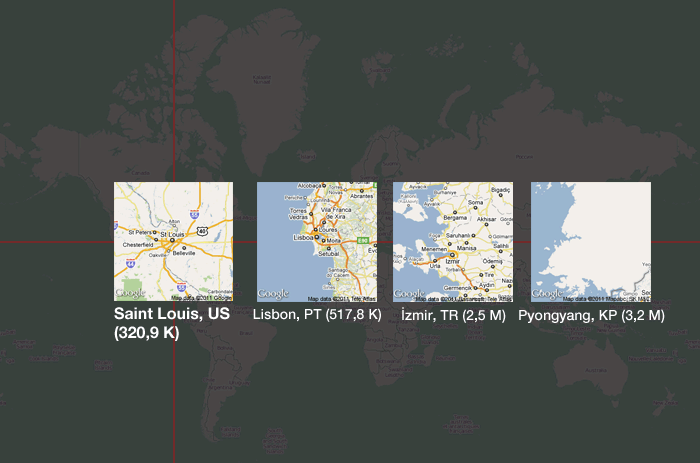
At the fundraiser, there were plenty of broshures talking about Estonia and what great a place it is to live and visit. All and all, it was interesting, but one page especially caught my eye. It was a small thumbnail map of Estonia along with several other thumbnail maps. It took a few seconds to register what was going on, but after that I realized the potential in the designed. Sadly, I lost the original booklet, but I remember it well and replicated the basic design.
It is interesting to see someone else’s work and get inspirated, but if you can’t execute on the idea yourself, then what good was the inspiration? This is where knowing your resources is key. For just about anything geographical, my first stop is Geonames.org. I have used their code in several other projects, including the HLS World Map and Geonames maps. It is as simple as it gets, a Comma Seperated Value list of places with plenty of metadata.
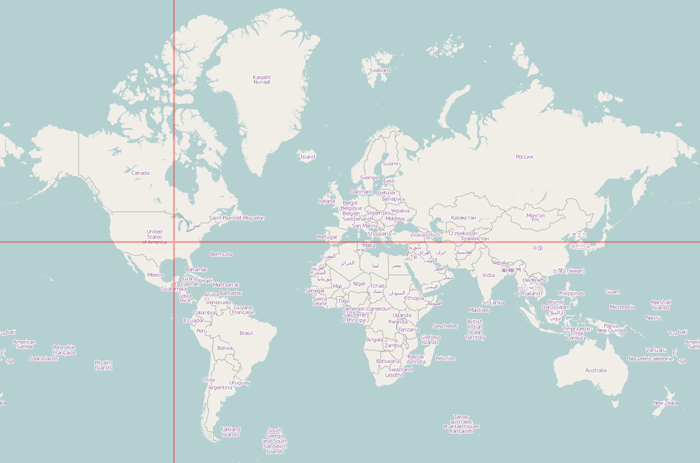
If I wanted to replicate the thumbnail maps in the broshure, I knew I needed city names, and lots of them. In geonames, you can download a list of every town with a population over 1,000 people. Granted, this data might not be the most up-to-date, for most of my projects it’s fine. The next step was to pick a starting city. On the first go, I chose Reykjavík. While it makes sense as a local starting point, it isn’t geographically that interesting, we’ll see why in a bit. So I went with Saint Louis, Missouri, USA. A quick search on Wikipedia and I’ve got the Latitude and Longitude of the city; 38.627222,-90.197778.
The next step is to choose and arbitrary tolerance in the number of degrees, sort of geographical error bars. I started with +/- 1.0 degrees. For Saint Louis, this would mean a Latitude of 37.627222 to 39.627222 and a Longitude of -91.197778 to -89.197778. This tolerance can be adjusted to taste.
Now that we have this thin band of acceptable latitude and longitude values, I looped through the complete list from geonames to find “sister” cities on the same latitude and repeat the process to find “sister” cities at the same longitude.
The original map of Estonia was a series of thumbnails left and right, showing other large cities at the same latitude and a series of thumnails up and down showing cities at the same longitude. It was simple and interesting to see how geographically similar cities might have vastly different climates, cultures, language and history. Now, with some simple logic, a few lines of code and the geonames database, it’s easy to recreate this for any location!
For Saint Louis there were many results, so I reduced the tolerance to only 0.25 degrees and limited the results to cities to those with a population of 100,000 or higher. The following cities matched her latitude:
- Yinchuan, China: 38.46806,106.27306
- Xinzhou, China: 38.40917,112.73333
- Jinchang, China: 38.49528,102.17389
- Dingzhou, China: 38.51306,114.99556
- Baoding, China: 38.85111,115.49028
- Marand, Iran: 38.4329,45.7749
- Khvoy, Iran: 38.5503,44.9521
- Ishinomaki, Japan: 38.41667,141.3
- Songnim, North Korea: 38.75417,125.645
- Sariwŏn, North Korea: 38.50722,125.75583
- Namp’o, North Korea: 38.7375,125.40778
- Setúbal, Portugal: 38.5244,-8.8882
- Queluz, Portugal: 38.75,-9.25
- Lisbon, Portugal: 38.71667,-9.13333
- Amadora, Portugal: 38.75382,-9.23083
- Dushanbe, Tajikistan: 38.53575,68.77905
- Van, Turkey: 38.49239,43.38311
- Uşak, Turkey: 38.67351,29.4058
- Turgutlu, Turkey: 38.49533,27.6997
- Manisa, Turkey: 38.61202,27.42646
- Kayseri, Turkey: 38.73222,35.48528
- İzmir, Turkey: 38.41273,27.13838
- Elazığ, Turkey: 38.67431,39.22321
- Afyonkarahisar, Turkey: 38.75667,30.54333
- Alexandria, USA: 38.80484,-77.04692
- Roseville, USA: 38.75212,-121.28801
- Sacramento, USA: 38.58157,-121.4944
- Santa Rosa, USA: 38.44047,-122.71443
- Colorado Springs, USA: 38.83388,-104.82136
- Qarshi, Uzbekistan: 38.86333,65.79778
These cities matched her Longitude:
- Metairie, USA: 29.98409,-90.15285
- Metairie Terrace, USA: 29.97854,-90.16396
- New Orleans, USA: 29.95465,-90.07507
- Jackson, USA: 32.29876,-90.18481
- Memphis, USA: 35.14953,-90.04898
- New South Memphis, USA: 35.08676,-90.05676
As you can see, the list is still fairly large. This will certainly depend on your tolerance as well as your geographic location. Poor Reykjavík is pretty far north. At that latitude it doesn’t have any “sister” cities in North America. Only a handful in Asia and Scandinavia. As for longitude, Iceland sits in the middle of the Atlantic, so there is nothing south of Iceland until Antarctica! Therefore, the results aren’t that interesting as an example.
We can easily run the same equation for any location, Edinburgh, Scotland for example has the following results:
- Århus, Denmark: 56.15674,10.21076
- Glasgow, Scotland: 55.86515,-4.25763
- Šiauliai, Lithuania: 55.93333,23.31667
- Panevėžys, Lithuania: 55.73333,24.35
- Klaipėda, Lithuania: 55.71722,21.1175
- Daugavpils, Latvia: 55.88333,26.53333
- Zelenograd, Russia: 55.9825,37.18139
- Vladimir, Russia: 56.14278,40.39806
- Shchelkovo, Russia: 55.89278,38.05694
- Orekhovo-Zuyevo, Russia: 55.81083,38.97194
- Novocheboksarsk, Russia: 56.11056,47.47778
- Noginsk, Russia: 55.85361,38.44111
- Neftekamsk, Russia: 56.08333,54.26667
- Naberezhnyye Chelny, Russia: 55.7354,52.4101
- Mytishchi, Russia: 55.90889,37.73389
- Moscow, Russia: 55.75222,37.61556
- Khimki, Russia: 55.90167,37.4375
- Kazan’, Russia: 55.7877,49.1248
- Korolëv, Russia: 55.91417,37.82556
- Elektrostal’, Russia: 55.79194,38.44222
- Cheboksary, Russia: 56.13222,47.25194
- Balashikha, Russia: 55.80278,37.94861
- Krasnoyarsk, Russia: 56.00972,92.79167
- Bratsk, Russia: 56.1325,101.61417
Longitudinal matches:
- Bilbao, Spain: 43.26271,-2.92528
- Alcalá de Henares, Spain: 40.48333,-3.36667
- Newport, Great Britain: 51.58774,-2.99835
- Liverpool, Great Britain: 53.41058,-2.97794
- Dundee, Great Britain: 56.5,-2.96667
- Cardiff, Great Britain: 51.48,-3.18
- Blackpool, Great Britain: 53.81667,-3.05
- Nador, Morocco: 35.17404,-2.92866
Now that we have the list along with the metadata, we can go and grab some thumbnails of each area. The first place that came to mind for free map tiles was Open Street Map. They have an export feature which allows you to grab a PNG or JPEG images with a specific bounding box. The URL looks something like:
http://tile.openstreetmap.org/cgi-bin/export?bbox=-90.3092,38.5734,-90.0627,38.6722&scale=110000&format=png
It is easy to change the top, bottom, left and right values to grab a thumbnail for a different region. The downside to Open Street Map is that the server isn’t always responsive. It is an open source project which always needs more resources, so I went looking for alternatives so I wasn’t pounding the Open Street Map server too much. Google Maps offers a Static API service. The terms of service are limited, so the tiles you grab you probably can’t use in commercial applications, but as a sanity check it is an excellent first pass. The URL to grab a static map image looks like this:
http://maps.google.com/maps/api/staticmap?zoom=11&size=512x512&maptype=roadmap¢er=38.627222,-90.197778&sensor=false
Again, you can easily change the latitude and longitudes and generate a new thumbnail for each “sister” city.
The next thing I want to try and do is limit it to “interesting” results. This might be difficult to do programatically. Does population of the city have more weight than location? Do you want to try and space out “sister” cities evenly, ignoring other metadata? The results will probably need to be curated by some human intervention or powerful heuristics.
Once you have your sub-set of interesting sister cities, it can finally be arranged in a way similar to the original broshure. At this point, you can modify the look and feel as needed.
I needed a name for this style map to make it easier for me and friends to refer to this in the future. I was originally reminded of Pantone color chips. How each chip can be reordered and put next to others to see how they look in combination. So the name “city chips” was kicked around for a bit. Someone thought it was a new brand of Potatoe Chip Snack Foods, so we continued looking. Pantone chips are also referred to as color swatches, so “City Swatches” was born.
I have a few ideas and projects where this sort of style of small, broken-up map swatches will add clarity and zoom levels in a static, analog print medium. As a way to condense geographically disperse areas into something more linear and manageable, City Swatch style maps might be just what is needed.

