Introducing the Today I Learnt Database.
Over the last few years, each day we’ve been collecting a few ‘interesting’ headlines. We dropped them into a text file and at the end of the year went through everything, converted it to HTML and added some tags. It was an interest, but long process. We always had the intentions of doing something with these headlines!
We were fortunate enough to attend NewsFoo a few times. At one event, we met Ben Huh who was starting a new way to consume News called “The Moby Dick Project“. You can read more about it on Archive.org since the original post is gone. This eventually spun out to become Circa, which closed and then re-opened under new management.
The original concept was a sort of three column view with each column changing in speed and curation. The first might be the news story, the second related events and the third comments. We remember it being described as consuming your Vegetables and Sweets!
What struck a cord with us was that there are plenty of stories that you say to yourself “Hey remember when that happened, did they ever find out why?”. Traditional news websites seem to be setup to show you articles and are not great at stringing things together. Wikipedia isn’t bad, but the content keeps getting written over and it is objective as opposed to user-generated comments.
When we started to collect our headlines, we wanted a way to track long story arcs. If we saw a headline in January, then again maybe 4 to 6 weeks later with something more or even a resolution, we want a way to thread them together. In our world of headline click-bait, we rarely get to see longer trends. That is one of the goals we wanted to achieve with our TIL headlines project.
Todo all this, we needed to move it out of these text articles into something more dynamic and clickable. Something that could continue to evolve and have old headlines become richer with the addition of new.
In our spare time, we converted the old HTML and tags into SQL statements and loaded everything up in to a relational database. That allowed us to make dynamic connections. We can browse by year, month, day or tag. You can search and filter and we can get frequency counts over time to show the number of mentions of a specific topic.
You can browse the TIL DB at https://til.optional.is
What we’ve done so far are “table stakes”. It’s what you would expect from linked data: the ability to browse, pivot between topics and dates.
Our goal was to take it one step further. Back in 01998, Matt Webb created DIRK: The fundamental connectedness of all things. It was an RDF store of assertions in the form of “Subject Predicate Object”.
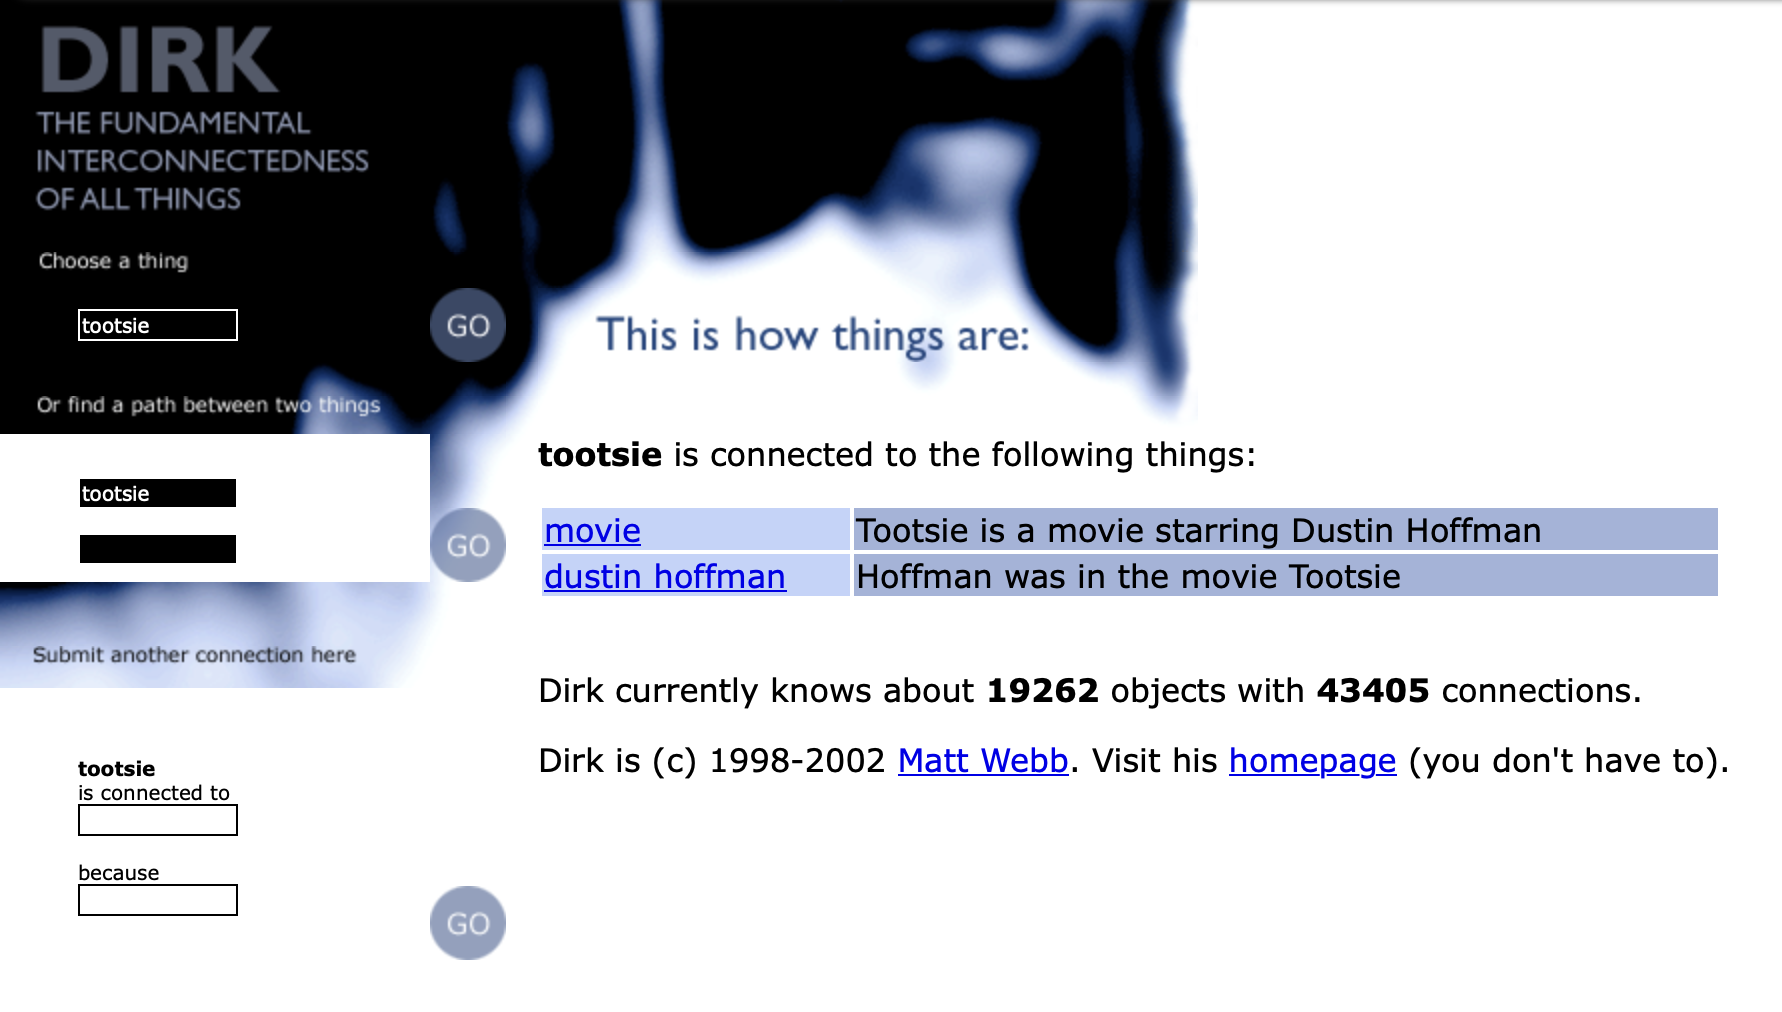
For instance: Reykjavik is in Iceland. Iceland is in Europe. Therefore, we can conclude Reykjavik is in Europe. If you string enough of these assertions together you can get to some interesting connected places. To make our TIL DB more interesting, we start to write some of our own assertions based on the existing tags we put on the headlines. This adds more value to the tags and focuses our attention on what tags to use.
For instance: Betty White, beloved and trailblazing actress, dies at 99 was tagged obituary, tv, Betty White. We can use that to make a few assertions: Betty White is connected to obituary because she died at the age 99. Betty White is connected to tv because she stared in the Golden Girls.
This allows us to see how Betty White is connected to other tags through tv or obituary and why. Much like DIRK, we can click through various assertions, but we are trying to tie ours to facts in headlines.
We built a web form to connect any two tags in our system so you can see the steps between them. It is a slow process which will grow worse over time with more and more content. The fun is seeing how two random terms are related and how few steps it takes!
Just use AI
Artificial Intelligence is certainly the buzzword soup de jour these days. So let’s look at how and where AI could be useful.
We are curating our headlines that we save based on lots of factors: importance, likelihood of a longer arc, non-reoccurring events and frequency. Every fall we get a new iPhone, every winter it snows; those are not headlines worth collecting for longer arcs. The Ukrainian-Russian war is still on going, and we’re not saving headlines of daily attacks – that’s (sadly) now background noise. The curation will stick with us for now.
Tagging is a tedious task that we’ve asked AI to help with. We have a giant json dump of headlines and tags with their corresponding database ids. The AI can ingest that easily and try to make some recommendations. That works for most things, it has some false-positives, but also feels a bit like it hits a local maximum. It heavily recommends existing tags and isn’t great at making new ones. It doesn’t “know” (it’s just a statistical machine) what new tags are useful or important.
We tried to get AI to write short assertions and it completely fell apart. The headlines are so short and there is extra, external knowledge that the AI doesn’t have. Their suggestions were longer than the headline and often just wrong. That’s a lost cause.
The two key insights people have told us about AI is that:
- It doesn’t know anything current. It is not a web crawler so don’t ask it about current events (like today’s headlines!)
- Rather than ask it to do something, ask it to write a script to do that. Then it is repeatable and deterministic outside of their AI ecosystem.
We do use script to convert our text file to sql statements and scripts to export/dump the database into json formats. AI could help write these scripts, but that’s just fancy auto-complete/spell-check. There is no “AI” in the product.
Next Steps
Everyday we continue to collect headlines and each month we try to import them into the database with tags. We are very far behind on the assertions. We need to make ourselves a small tool that just shows us a few un-asserted tags each day and we take smaller nibbles to add more metadata.
We’ve also considered away to make it more wiki-like and allow anyone to edit (or suggest) changes to tags and assertions. We’re not sure if the effort to build it compared to the audience actually contributing is worth it right now.
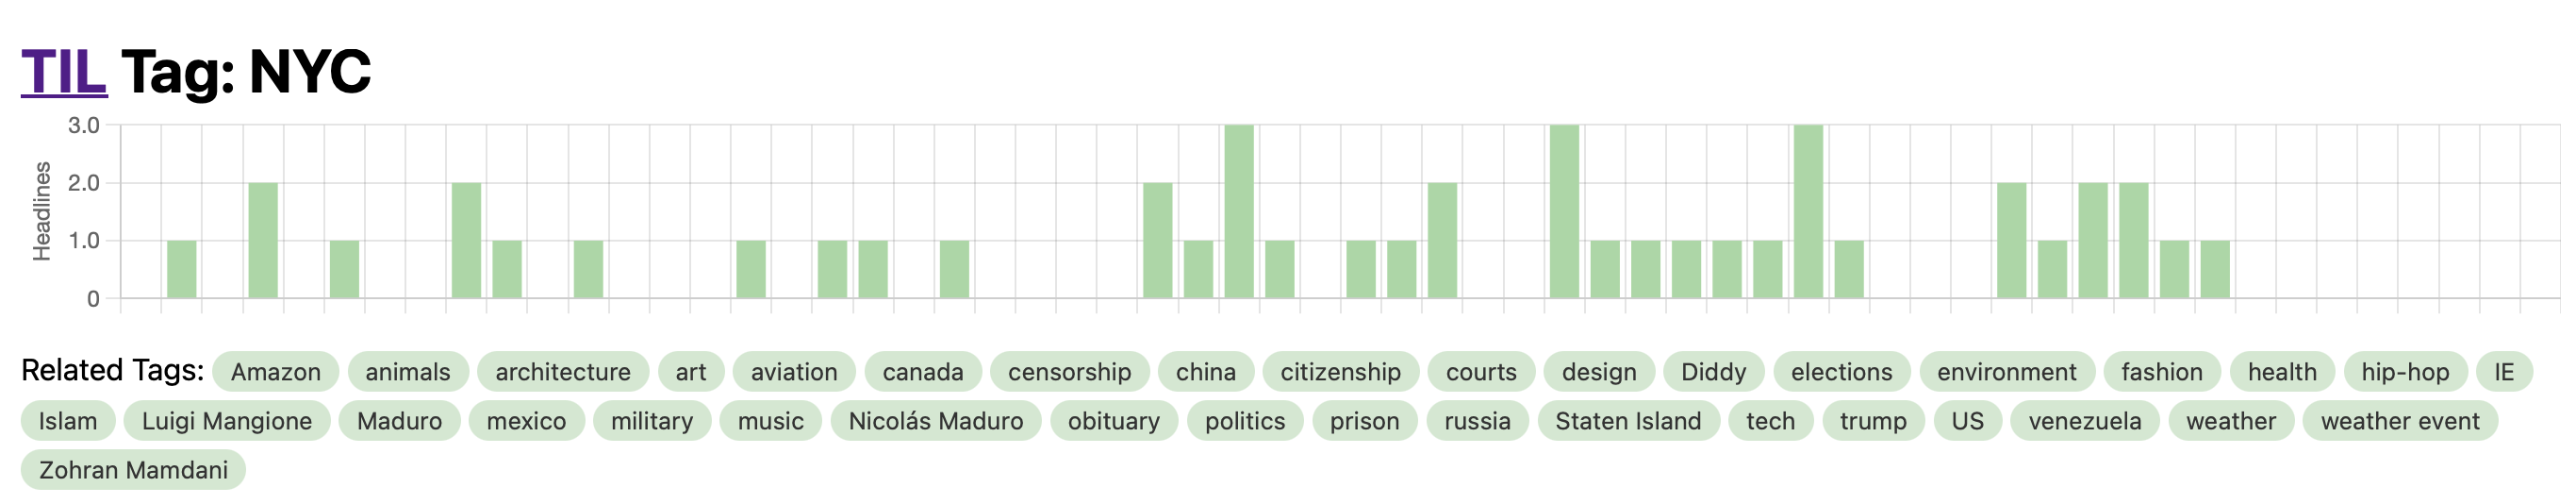
There are probably some smaller statistical tasks which we can add. Right now we chart tag frequency by month and you get a really good overview of trending topics. There are certainly more statical functions we can add like standard deviation, time between headlines, etc. Our advanced search allows for selecting a few tags and only showing headlines with ALL those tags (an AND search). We could try to do more frequency analysis on these 2 and 3 tag combinations.
The bare minimum is for us to continue to collect headlines. Once we have the data we can always add more metadata at a later date.
Go and explore the TIL DB at https://til.optional.is see what’s missing and let us know what can be improved.