This year’s world cup was another thriller. Here in Iceland, we narrowly lost out to Croatia to get into the tournament. The secondary fallback for the office was the USA. Partly due to some of our team having roots there, but also for the Icelandic player who choose to play for the US rather than his main citizenship, Iceland.
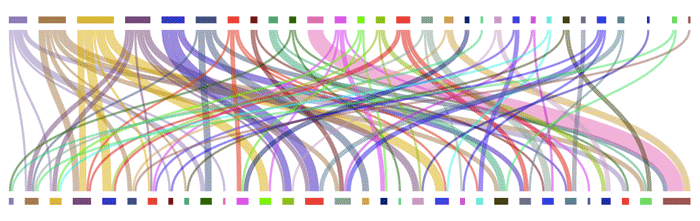
A few years ago, we developed a simple PHP script to generate some SVG to show the flow of data to and from sources. We experimented with various use-cases. When one person sends an email to another, and receives email from a third. We originally created a wheel which showed incoming and outgoing messages. When the numbers got large, things got messy. It was hard to tell what was incoming and what was outgoing. Our second attempt at this was to have redundant actors, once across the top of the page and again at the bottom of the page. From that, it was easy to see what messages were out going and to whom. Also across the bottom it was easy to see incoming messages and from whom they came. This worked really well for communications, but we thought about other data that could easily fit this mold. Luckily, it was World Cup season 02010 and we quickly realized that teams both score goals and concede them, just like we send and receive messages. So we fired-up some code and generated some SVGs. This is what the raw output looked like:
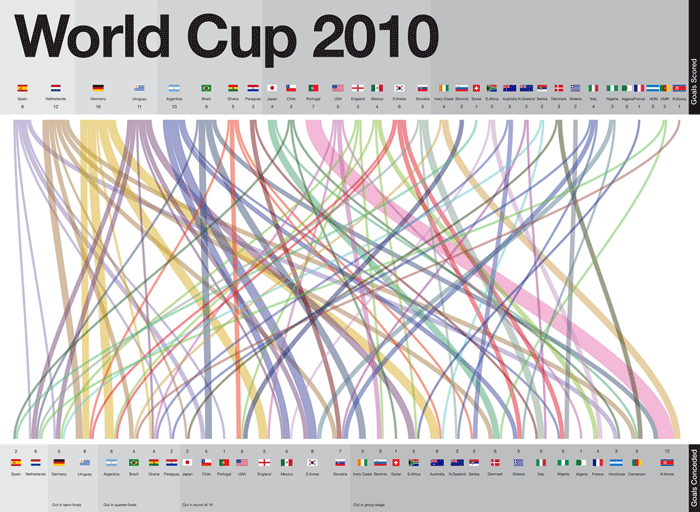
We then took that data and brought it into Illustrator to add some notes, groups, team flags, etc. After those changes we got to something that looked more like this:
Fast-forward to 02014 and we’ve got another World Cup on our hands. We dug through the old code repository and updated the values with this year’s teams and goals. Within a few minutes we had our data visualization again. That’s the great thing about doing this in code rather than by hand, it might have taken a bit longer when we started, but now that the code is working, we can updated data very, very fast.
Here is what the raw output looked like after running it through the code:
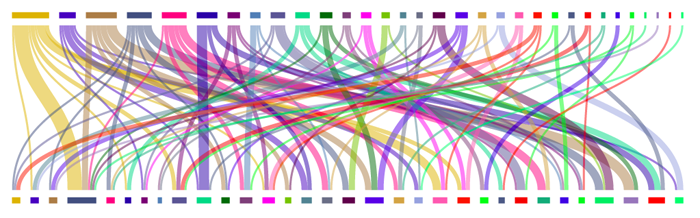
The colors chosen for each country are simply using our In Rainbows GetColor function. We’ve written about choosing colors plenty of times before and there are lots of ways we could have done this; In Rainbows, HLS World Map or something else entirely. As a first pass to make distinct colors this works like a charm.
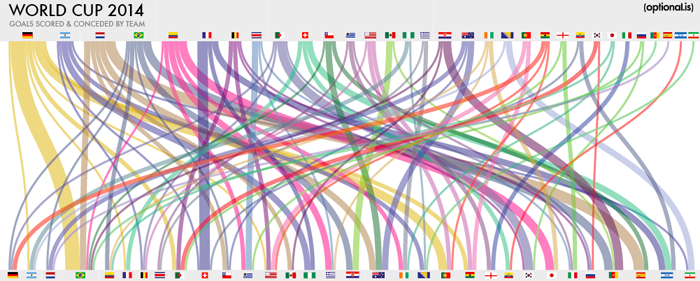
After playing around with the design a bit further in Illustrator, adding flags and other features, we’ve created this:
We’re happy with the final product, but you might be curious about how we make all those lines and curves in code. It certainly isn’t magic, and it is probably way easier than you might think. We’ve put all the code to make these to_from visualization on GitHub. There you will find the 02010 code as well as the 02014 example.
If we look more closely at the code itself, you’ll see that it isn’t as complicated as you might expect.
<?php
/*
Brian Suda
brian@suda.co.uk

Using data from the 2014 world cup, this to_from chart visualizes the goals scored and goals conceeded for each team in the tournament.

Usage:
php wc2014_tofrom.php > output2014.svg

*/

// Make sure we are sending the right mimetype
header('Content-Type: image/svg+xml');

// Output the standard XML declaration, doc type and start the SVG element
echo '<?xml version="1.0" standalone="no"?>
<!DOCTYPE svg PUBLIC "-//W3C//DTD SVG 1.1//EN" "http://www.w3.org/Graphics/SVG/1.1/DTD/svg11.dtd"><svg width="100%" height="100%" version="1.1" xmlns="http://www.w3.org/2000/svg">
';

// Build-up an array of key=>array() mappings for each team and who they scored against.
$messages =
array(
	// Finals
	"Germany"        =>array("Argentina","Brazil","Brazil","Brazil","Brazil","Brazil","Brazil","Brazil","France","Algeria","Algeria","United States","Portugal","Portugal","Portugal","Portugal","Ghana","Ghana"),
	"Argentina"      =>array("Belgium","Switzerland","Nigeria","Nigeria","Nigeria","Bosnia and Herzegovina","Bosnia and Herzegovina","Iran",),

	// Semifinals
	"Netherlands"    =>array("Brazil","Brazil","Brazil","Chile","Chile","Mexico","Mexico","Australia","Australia","Australia","Spain","Spain","Spain","Spain","Spain",),
	"Brazil"         =>array("Germany","Netherlands","Colombia","Colombia","Chile","Croatia","Croatia","Croatia","Cameroon","Cameroon","Cameroon","Cameroon",),

	// Quarter Finals
	"Colombia"       =>array("Brazil","Uruguay","Uruguay","Greece","Greece","Greece","Ivory Coast","Ivory Coast","Japan","Japan","Japan","Japan"),
	"France"         =>array("Switzerland","Switzerland","Switzerland","Switzerland","Switzerland","Nigeria","Nigeria","Honduras","Honduras","Honduras"),
	"Belgium"        =>array("Algeria","Algeria","United States","United States","Korea Republic","Russia",),
	"Costa Rica"     =>array("Uruguay","Uruguay","Uruguay","Greece","Italy",),

	// Round of 16
	"Algeria"        =>array("Germany","Belgium","Korea Republic","Korea Republic","Korea Republic","Korea Republic","Russia",),
	"Switzerland"    =>array("France","France","Ecuador","Ecuador","Honduras","Honduras","Honduras",),
	"Chile"          =>array("Brazil","Australia","Australia","Australia","Spain","Spain",),
	"Uruguay"        =>array("Costa Rica","England","England","Italy",),
	"United States"  =>array("Belgium","Portugal","Portugal","Ghana","Ghana"),
	"Mexico"         =>array("Croatia","Croatia","Croatia","Cameroon"),
	"Nigeria"        =>array("Argentina","Argentina","Bosnia and Herzegovina"),
	"Greece"         =>array("Costa Rica","Ivory Coast","Ivory Coast"),

	// Group Stage
	"Croatia"        =>array("Brazil","Mexico","Cameroon","Cameroon","Cameroon","Cameroon"),
	"Australia"      =>array("Netherlands","Netherlands","Chile","Australia","Australia","Australia"),

	"Ivory Coast"    =>array("Colombia","Greece","Japan","Japan"),
	"Bosnia and Herzegovina" =>array("Argentina","Iran","Iran","Iran"),
	"Portugal"       =>array("United States","United States","Ghana","Ghana"),
	"Ghana"          =>array("Germany","Germany","United States","Portugal"),

	"England"        =>array("Uruguay","Italy","Italy",),
	"Ecuador"        =>array("Switzerland","Honduras","Honduras"),
	"Korea Republic" =>array("Algeria","Algeria","Russia"),

	"Japan"          =>array("Colombia","Ivory Coast"),
	"Italy"          =>array("England","England"),
	"Russia"         =>array("Algeria","Korea Republic"),

	"Cameroon"       =>array("Brazil",),
	"Spain"          =>array("Netherlands",),
	"Honduras"       =>array("Ecuador"),
	"Iran"           =>array("Bosnia and Herzegovina"),

);

// A few settings
$multiplier = 1;
$tCount = 0;
$bars   = array();
$toBars  = array();
$bbars   = array();

// Look through each of the teams and see who they scored against and keep a count
foreach($messages as $from=>$to){
  $tCount += count($to);
  $bars[$from] = count($to);
  for($i=0;$i<count($to);$i++){
	$posList = getKeyPos($messages,$to[$i]);
    $toBars[$from][$posList]++;
    $bbars[$posList]++;
  }

}

// output top bars and the curve to the bottom bars
$x = 0;
$bbarpos = array();
foreach($bars as $n=>$b){
  // Output the top bars at the right X,Y coordinates, the proper line width and color
  echo '<line x1="'.($x*1).'" y1="10" x2="'.(($x*1)+($b*1)).'" y2="10" stroke="#'.getColor($n).'" stroke-width="'.(3*$multiplier).'" fill="none"/>'."\n";

  $lineX = $x;
  // Loop through each of this teams games and draw the path to the corresponding bottom bar
  foreach($toBars[$n] as $k=>$tB){
     $lineX += $tB;
     $offset = (($k)*5);
     for($j=0;$j<$k;$j++){
		$offset += $bbars[$j];
     }

     $xx = $offset+$bbarpos[$k];
     $bbarpos[$k] += $tB;
     // print the path with the proper bezier curve. Handles pointing 50% of the way straight up/down
     echo '<path d="M'.($lineX-($tB/2)).',15C'.($lineX-($tB/2)).',50,'.($xx+($tB/2)).',50,'.($xx+($tB/2)).',95" stroke="#'.getColor($n).'" stroke-width="'.($tB*$multiplier).'" fill="none" opacity="0.5" />'."\n";

  }

  $x += (($b*1)+5);
}

// output lower bars
$x = 0;
$cn = array_keys($messages);
for($i=0;$i<count($bbars);$i++){
    echo '<line x1="'.($x*1).'" y1="100" x2="'.(($x*1)+($bbars[$i]*1)).'" y2="100" stroke="#'.getColor($cn[$i]).'" stroke-width="3" fill="none"/>'."\n";
    $x += $bbars[$i]+5;
}

// end the SVG element
echo '</svg>';

// using the In Rainbows color generation based on the Team Name
// http://optional.is/required/2014/03/11/in-rainbows/
function getColor($str){
  return substr(md5($str),0,6);
}

function getKeyPos($list,$key){
	$counter = 0;
	foreach(array_keys($list) as $k){
		if($k == $key) return $counter;
		$counter++;
	}
}

?>
That’s it. If you have any questions, comments, thoughts or want to use this code in your own projects, please do. We’d love to see other examples as uses for this to_from visualization.